Stablecoin Market Cap and Total Supply
Total stablecoin supply across chains, day by day, with its distance from the all-time high and the coins and chains behind it.
Multi-chainEthereumTron+4Daily supply by issuer, chain and currency, with years of history and a receipt for every figure, so a chart in a paper or a supervisory note can be checked by its next reader.
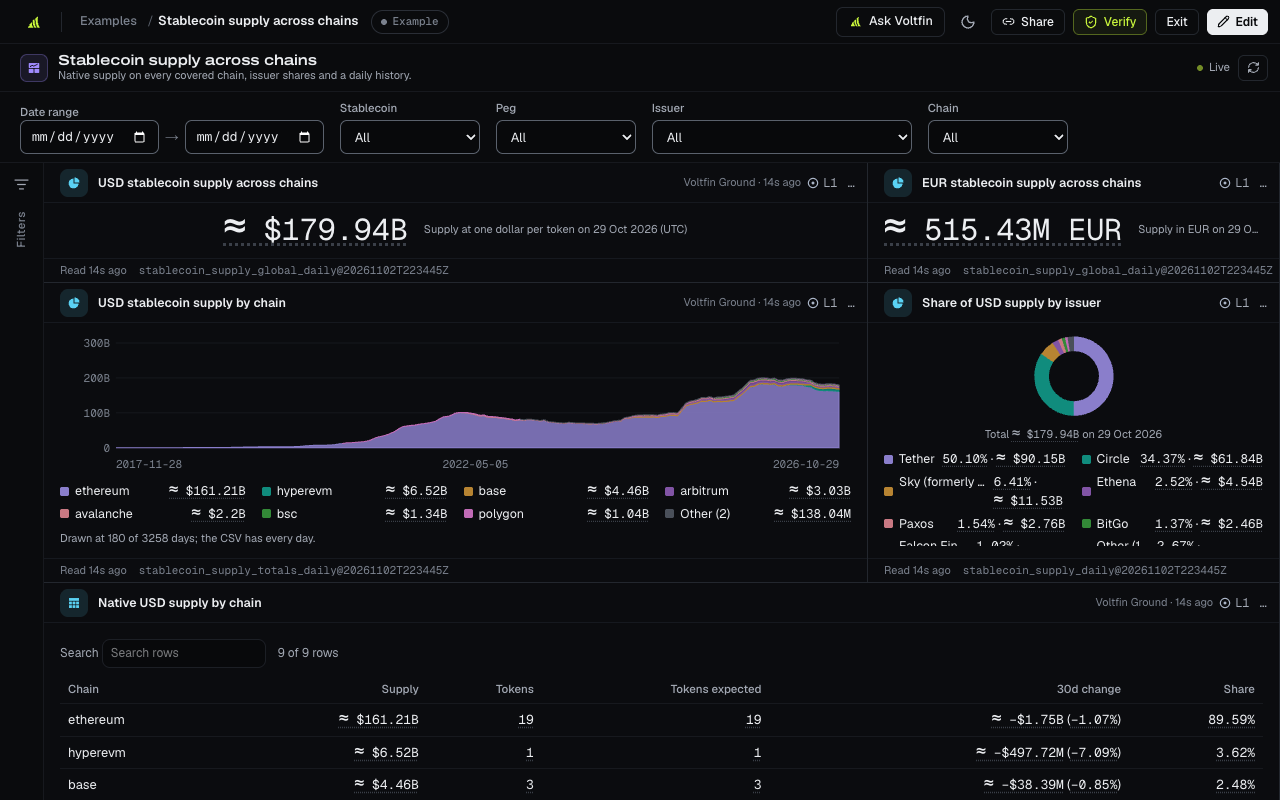
Captured 10 Nov 2026. The live example reads today's figures, each with its receipt.
Open full screen →Supervisors and researchers need stablecoin figures they can trace: where each number came from, and how to read it again.
Voltfin publishes versioned datasets: each figure names its dataset version and row, and each row its contract and block. A citation keeps working after the data moves on.
Dated monthly reports explain the change by chain and by coin, in prose, with every figure cited.
Each workflow with a live example: the published data as Studio shows it, every figure opening its receipt.
The problemA quoted figure is only as good as its source, and a reader has to be able to find that source.
With VoltfinEvery figure opens its receipt, which names the dataset version, the row, the contract and the block, so a citation points at the exact read.
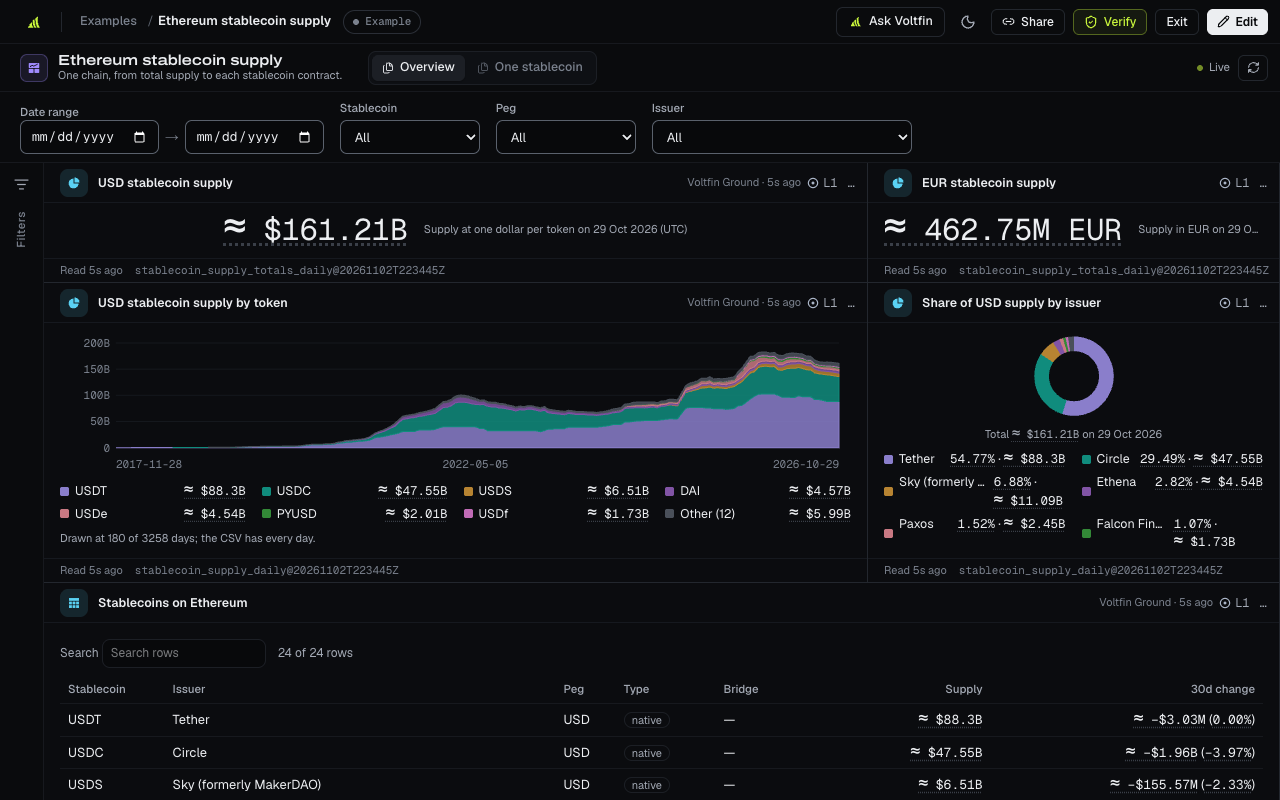
Captured 10 Nov 2026. The live example reads today's figures, each with its receipt.
Open full screen →The problemIssuers report circulation on their own pages. Checking it means reading every chain they are deployed on.
With VoltfinSupply by token, chain and day, from contract state, to set beside what issuers report.
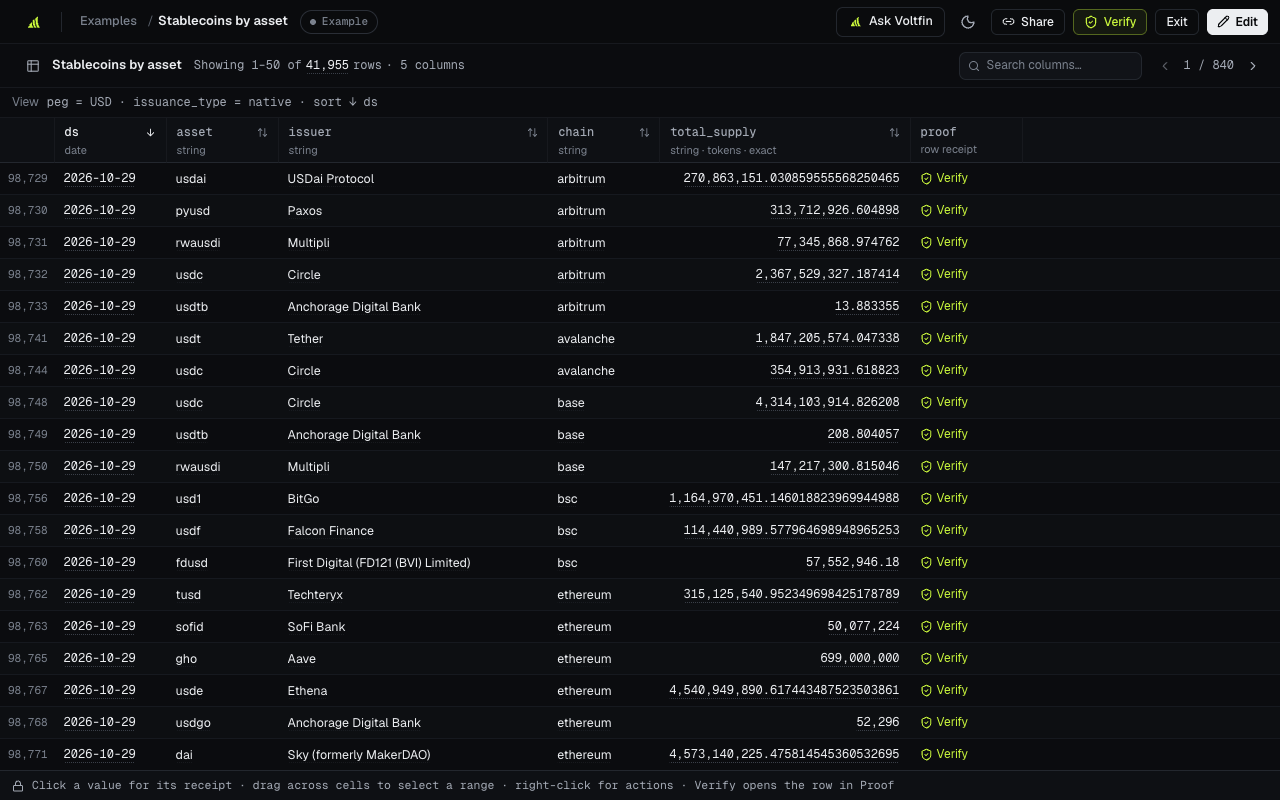
Captured 10 Nov 2026. The live example reads today's figures, each with its receipt.
Open full screen →The problemEuro stablecoins are a small, fast-moving market that dollar-centric figures hide.
With VoltfinThe same reads for both currencies, so a euro coin's footprint compares directly with a dollar one.
EURC across chains
Open full screen →Short summaries for orientation, not legal advice. Each links to its source.
Found gaps and inconsistencies in how jurisdictions implement the FSB's crypto-asset framework, and asked them to do more to close them.
Read the source European UnionQuarterly reports on holders, value issued, reserves and daily transactions for asset-referenced tokens above €100 million, and for e-money tokens in a non-EU currency.
Read the source297 of the 391 apps in the library are written for these teams. Each shows its blueprint now and its data plan.
Browse all 391 appsTotal stablecoin supply across chains, day by day, with its distance from the all-time high and the coins and chains behind it.
Multi-chainEthereumTron+4Each issuer's share of dollar stablecoin supply today and over time, from Tether and Circle to the newer issuers.
Multi-chainEthereumTron+1Every tracked stablecoin with its issuer, peg, backing, chains and circulating supply, in one table you can sort and filter.
Multi-chainEthereumTron+2Polymarket's daily trading volume, open interest and active traders, counted once per trade from its contracts on Polygon.
PolygonHow much USDT lives on Tron and how much of it moves each day: supply, issuance, transfers, sending accounts and transfer sizes.
TronWhere USDT and USDC each circulate chain by chain, and how the gap between Tether's and Circle's dollar coins changes over time.
Multi-chainEthereumTron+4Tell us what you report on, or start free and open any example in Studio.